High latency
High latency is a prevalent performance problem in streaming systems, and it can have multiple underlying causes. Excessive latency not only affects the freshness of data but also poses a risk to the overall stability of the system, potentially leading to out-of-memory (OOM) errors.
This guide aims to help you identify the root causes of high latency and provide effective solutions to address these issues.
Symptoms
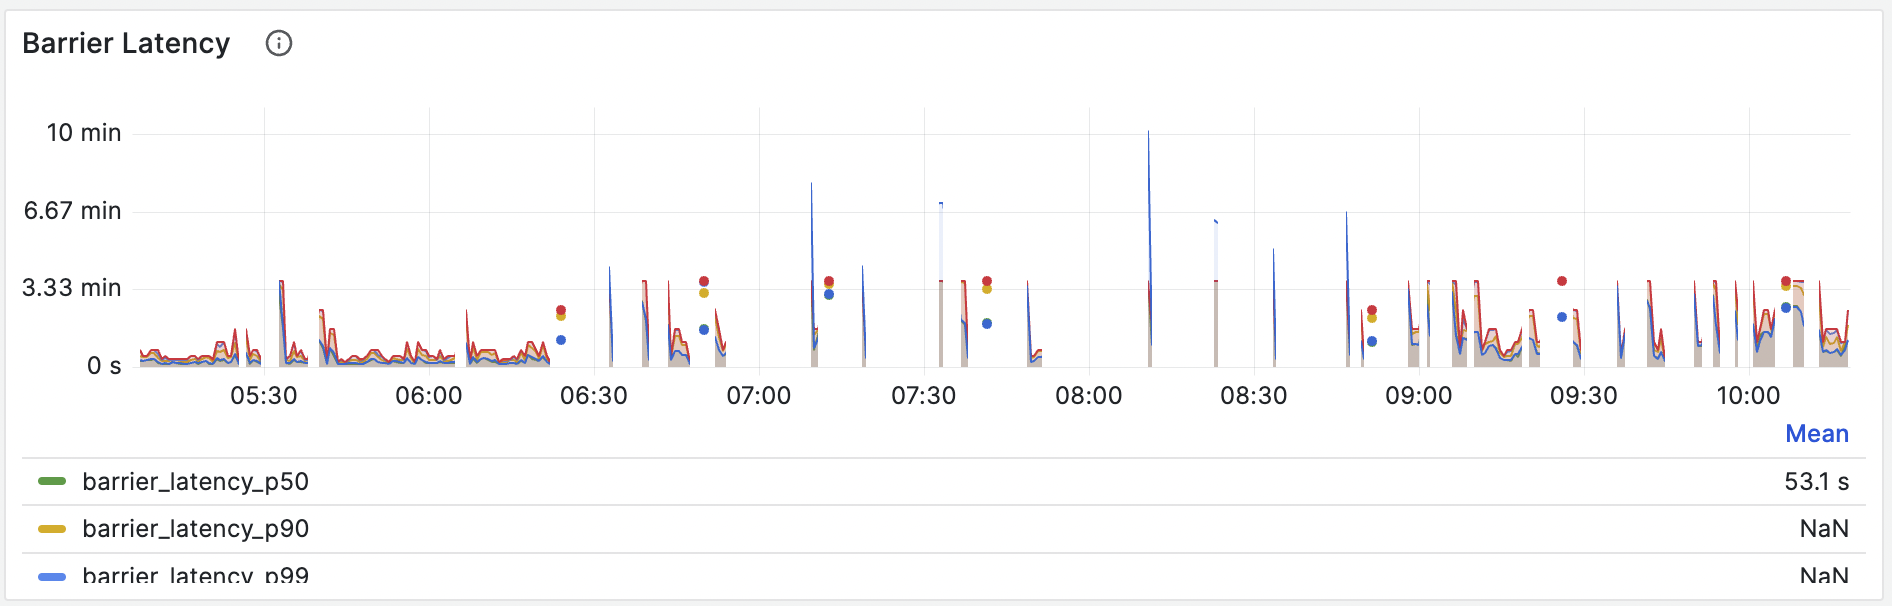
To identify barrier latency, navigate to the Grafana dashboard (dev) and access the Streaming section. From there, locate the Barrier Latency panel. The figure below is an example of what you will see. The latency curve in it is extremely high, indicating that the barrier is getting stuck.
Diagnosis
Some tools can be helpful in troubleshooting this issue:
Observe backpressure: Go to Grafana dashboard (dev) > Streaming Actors > Actor Output Blocking Time Ratio (Backpressure) panel, and analyze backpressure between fragments (actors). High backpressure between 2 fragments indicates that the downstream one is unable to process the data promptly, thereby slowing down the entire streaming job.
Check Await Tree Dump: Check the Await Tree Dump of all compute nodes in RisingWave Dashboard hosted on
http://meta-node:5691. If the barrier is stuck, the Await Tree Dump will reveal the barrier waiting for a specific operation to finish. This fragment is likely to be the bottleneck of the streaming job.
With these tools, you can identify the bottleneck fragments (actors) and the materialized views they belong to. Additionally, refer to the RisingWave Dashboard for the detailed information on materialized views, such as the streaming execution graph or the SQL query.
Solutions
Once you've pinpointed the bottleneck fragment, consider the following actions to resolve the issue:
Enhance the streaming query performance by removing or rewriting the bottleneck part of the SQL query.
Increase the parallelism by adding more nodes into the cluster, or check the SQL query to see if there is any room for optimization.
Example: High latency caused by high join amplification
Using low-cardinality columns as equal conditions in joins can result in high join amplification, leading to increased latency.
The term "Cardinality" describes how many distinct values exist in a column. For example, "nation" often has a lower cardinality, while "user_id" often has a higher cardinality.
When using a low-cardinality column as the equal condition for a join, such as A join B on A.nation = B.nation, any operation on a row in A or B will be amplified by the join to potentially thousands or millions of rows, depending on how many rows share that nation. This could lead to extremely high latency.
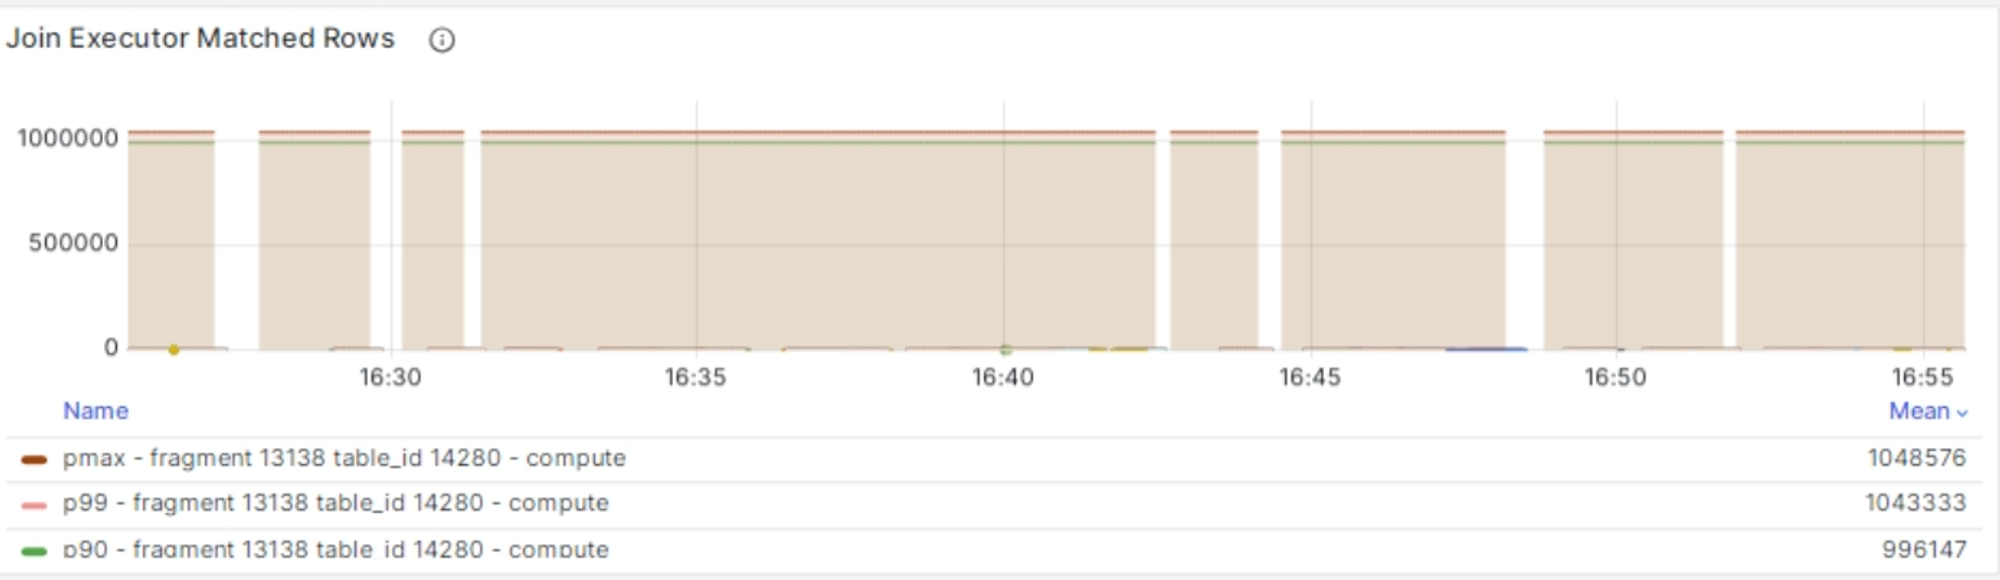
For example, the following figure shows a materialized view with extremely high latency caused by high join amplification. You can find this panel through Grafana dashboard (dev) > Streaming > Join Executor Matched Rows, which indicates the number of matched rows from the opposite side in the streaming join executors.
To address this problem, it is advisable to refactor the SQL query in order to minimize join amplification. This can be achieved by improving the equal conditions used in the problematic join, thereby reducing the number of matched rows.


