Troubleshooting
This guide assumes that you deploy RisingWave on K8s using the RisingWave K8s Operator. In the Operator, we packaged RisingWave, RisingWave Dashboard, and third-party observability and logging tools like Prometheus and Grafana.
Monitor your cluster
Get an overview of the cluster
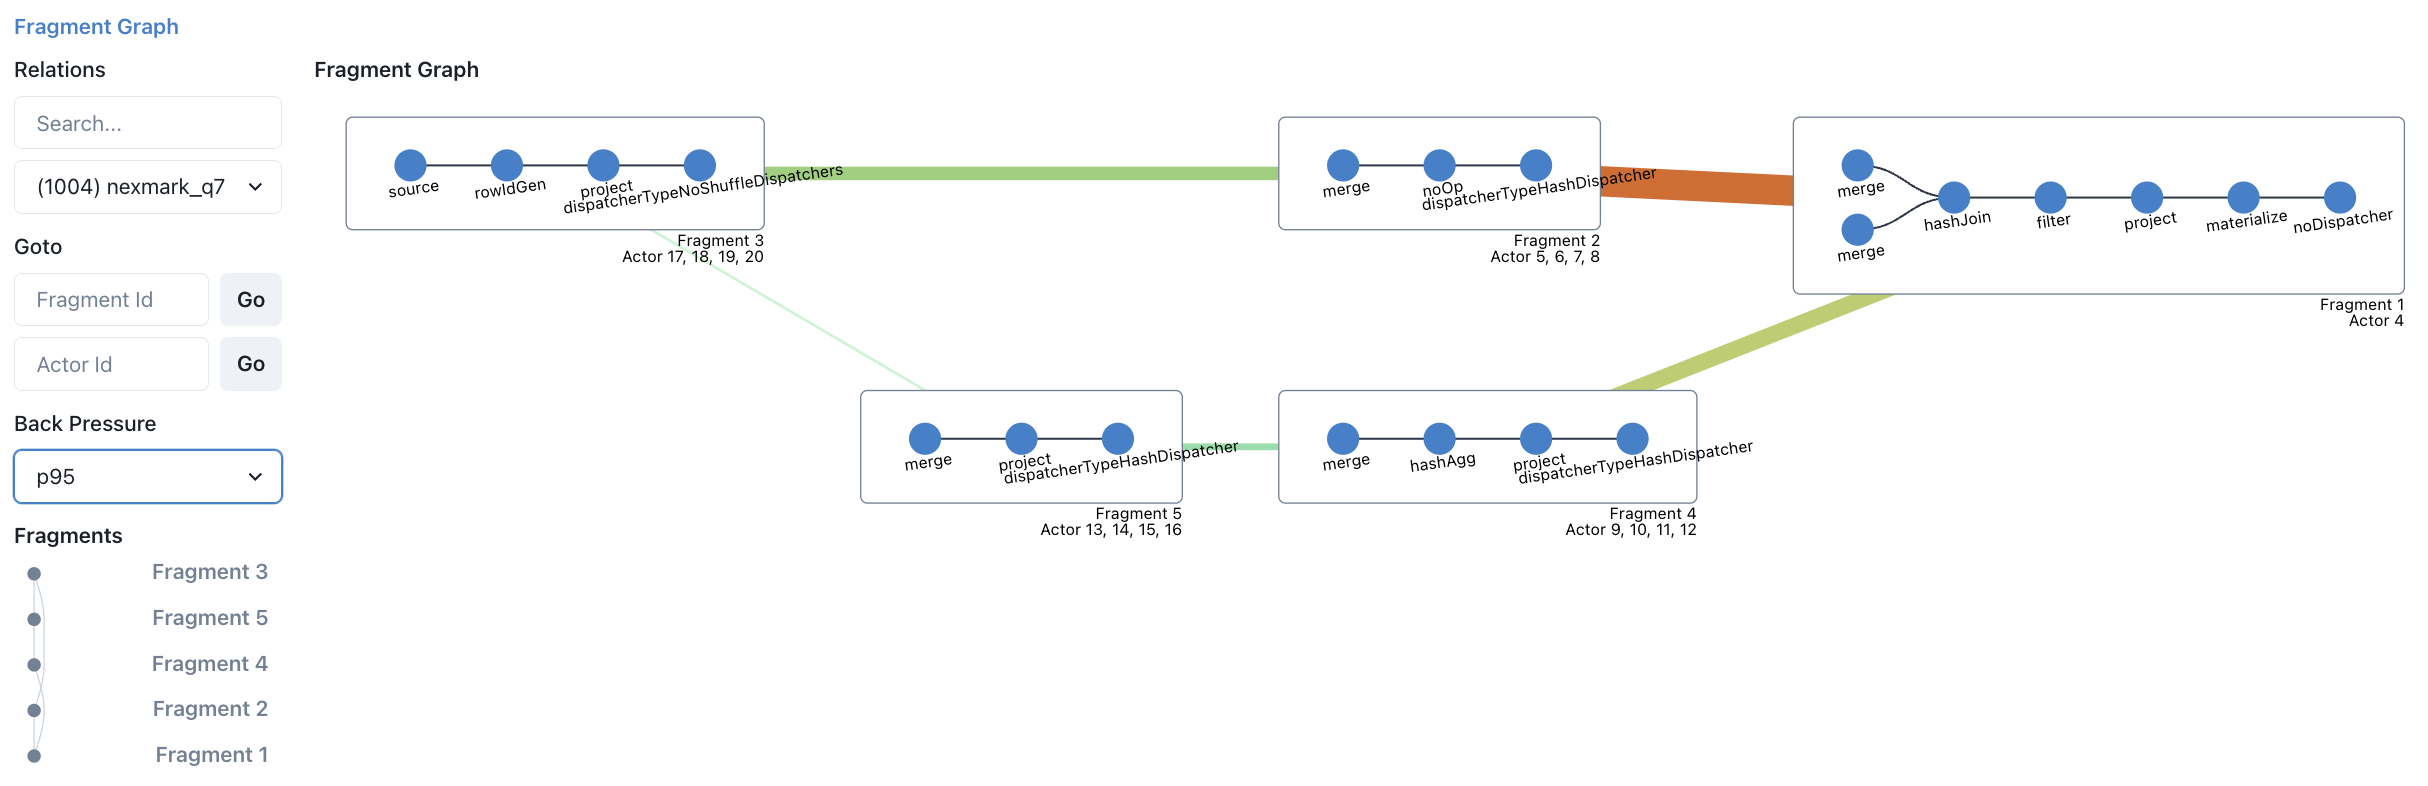
RisingWave Dashboard is the built-in dashboard of RisingWave. From RisingWave Dashboard, you can get an overview of your RisingWave cluster, including the objects that you have created, streaming or batch job execution details. The objects you can view include sources, tables, materialized views, indexes, internal tables, and sinks. For the fragment graph, the dashboard allows easy monitoring of the back-pressure rate through a color bar that varies in color and width based on the rate.
You can access RisingWave Dashboard at http://localhost:5692 by default.
View performance metrics
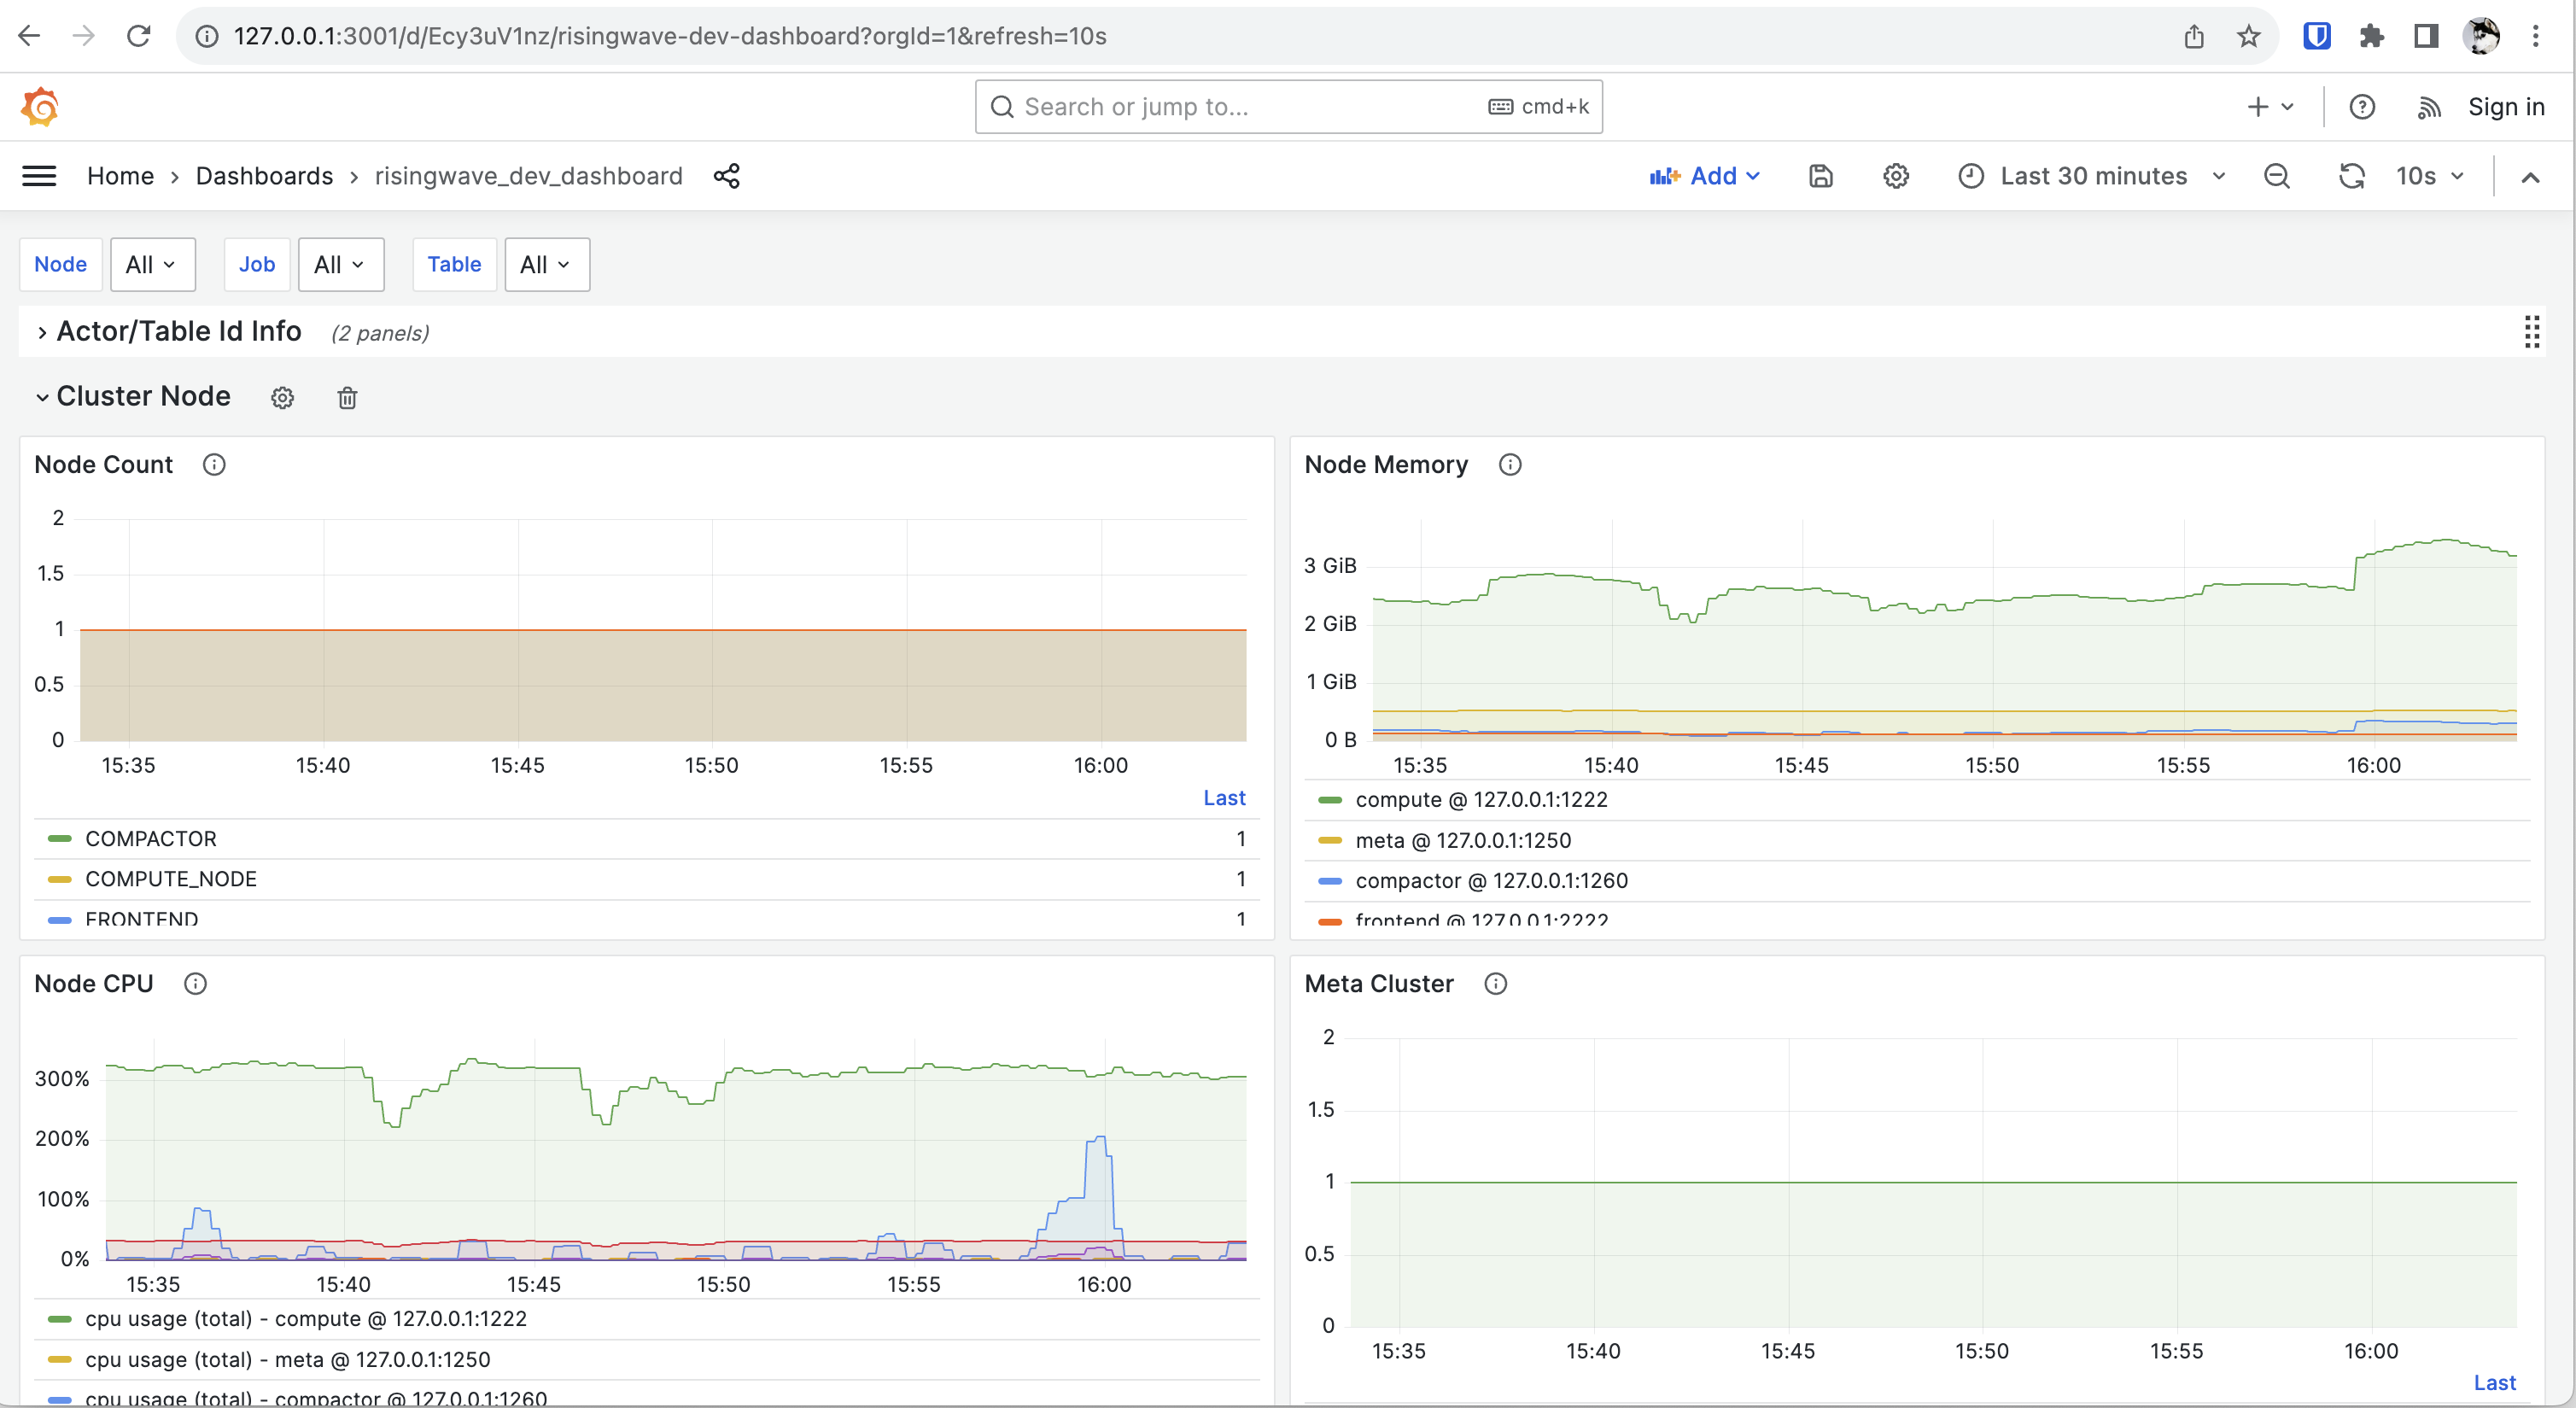
You can monitor the performance metrics of a RisingWave cluster, including the usage of resources like CPU, memory, and network, and the status of different nodes.
RisingWave uses Prometheus for collecting data, and Grafana for visualization and alerting. This monitoring stack requires configuration. To configure the monitoring stack, follow the steps detailed in Monitor a RisingWave cluster.
After you complete the configuration, go to http://localhost:3000 to access Grafana from a local machine, or [http://<client_address>:3000] to access Grafana from a different host, where <client_address> is the IP address of the machine running the Grafana service. When prompted, enter the default credentials (username: admin; password: prom-operator).
There are 2 built-in dashboards in the official release.
- risingwave_dashboard contains user-facing key metrics.
- risingwave_dev_dashboard contains more low-level metrics for RisingWave developers.
Review error messages and logs
Generally you get an error when something goes wrong. The error message should provide some basic information about what went wrong. We are summarizing the common errors and solutions. We'll publish this summary as soon as it's ready.
The logs of RisingWave are outputted to stdout by default. If you are deploying RisingWave via our official Kubernetes operator, you can view them via the kubectl logs command.
We recommend that you deploy a dedicated logging system, such as Grafana Loki or Elasticsearch.
Leverage system catalogs
System catalogs provide comprehensive information about the definitions and metadata of objects in RisingWave. For a detailed list of system catalogs available, see System catalogs.
Support resources
The most direct way to get help is by reporting your issues in our Slack Community workspace.
When reporting your issues in the Slack workspace, remember to include the logs. Including logs will help our engineers troubleshoot.
File an issue
If you've tried to troubleshoot an issue yourself but didn't succeed, you can file an issue in GitHub.
Please include the following details in your GitHub issue:
- A summary of the issue.
- The steps to reproduce the issue.
- The result you expected.
- The result that actually occurred.


