Monitor a RisingWave cluster
If you run RisingWave in a Kubernetes cluster, you can monitor its performance, including the usage of resources like CPU, memory, and network, and the status of different nodes.
Install the monitoring stack
To monitor a RisingWave cluster, you can use the monitoring stack in the RisingWave-Operator repository. The stack includes Prometheus for collecting data, Grafana for visualization and alerting, and other necessary resources.
Clone or download the RisingWave-Operator repository to your environment.
git clone https://github.com/risingwavelabs/risingwave-operator.git
Run the script to install the monitoring stack. It will create the monitoring namespace and deploy all monitoring services in the namespace.
./monitoring/install.sh
Start monitoring
The RisingWave operator is now integrated with the Prometheus operator, which creates a service monitor for RisingWave and ensures that data is collected automatically.
- Check if Prometheus is collecting data from RisingWave:
kubectl get servicemonitors -A -l risingwave/name
The expected output is like this:
NAMESPACE    NAME                         AGE
monitoring   risingwave-service-monitor   119m
- Forward the web port of Grafana to localhost .
kubectl port-forward -n monitoring svc/prometheus-grafana 3000:http-web
The command above allows you to access Grafana from the local machine only. If you need to access Grafana from a different host, append --address 0.0.0.0 to the command to allow Grafana to accept requests from external hosts. The complete command is:
kubectl port-forward -n monitoring svc/prometheus-grafana 3000:http-web --address 0.0.0.0
Go to http://localhost:3000 if you access Grafana from a local machine, or [http://<client_address>:3000] if you access Grafana from a different host, where
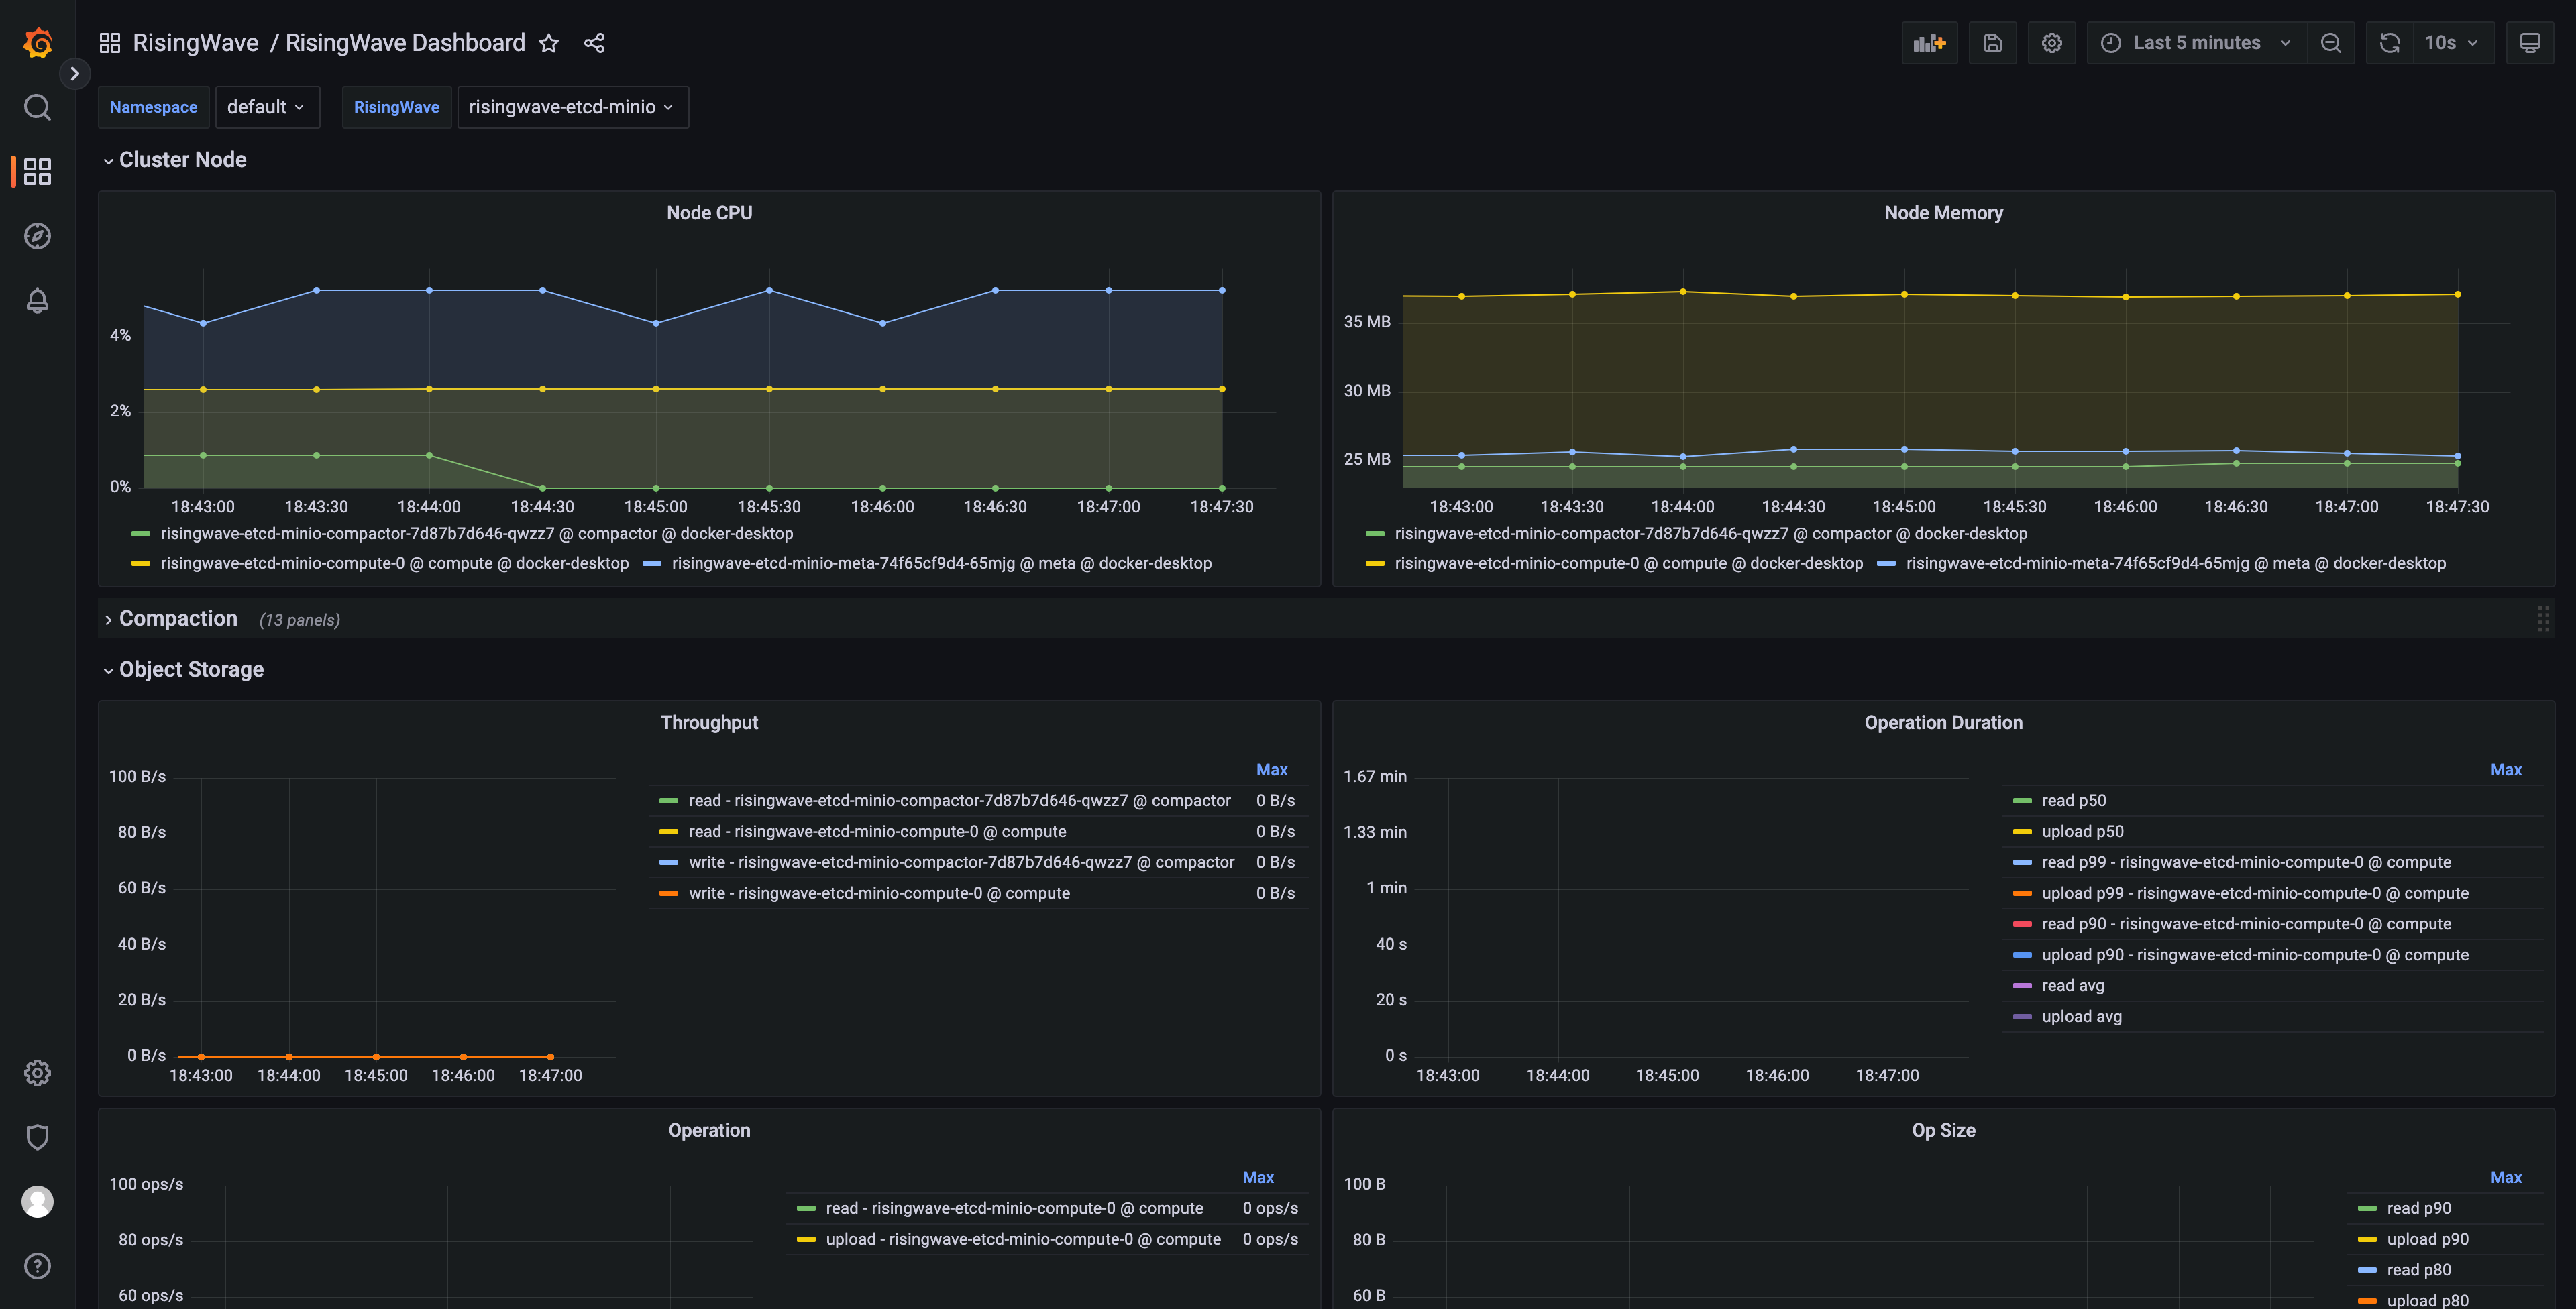
<client_address>is the IP address of the machine running the Grafana service. When prompted, enter the default credentials (username:admin; password:prom-operator).From Dashboards, select RisingWave -> RisingWave Dashboard. You can edit metrics in the dashboard and add new metrics.