Performance metrics
This topic lists some notable metrics shown on the RisingWave’s Grafana dashboard that can help us diagnose potential problems.
The details of the dashboard can be found here. In particular, there are two files:
Implement a dev-facing dashboard. It includes finer-grained metrics. Many of them may only make sense to the developers of a specific component.
Implement a user-facing dashboard. It summarizes some high-level metrics.
CPU usage
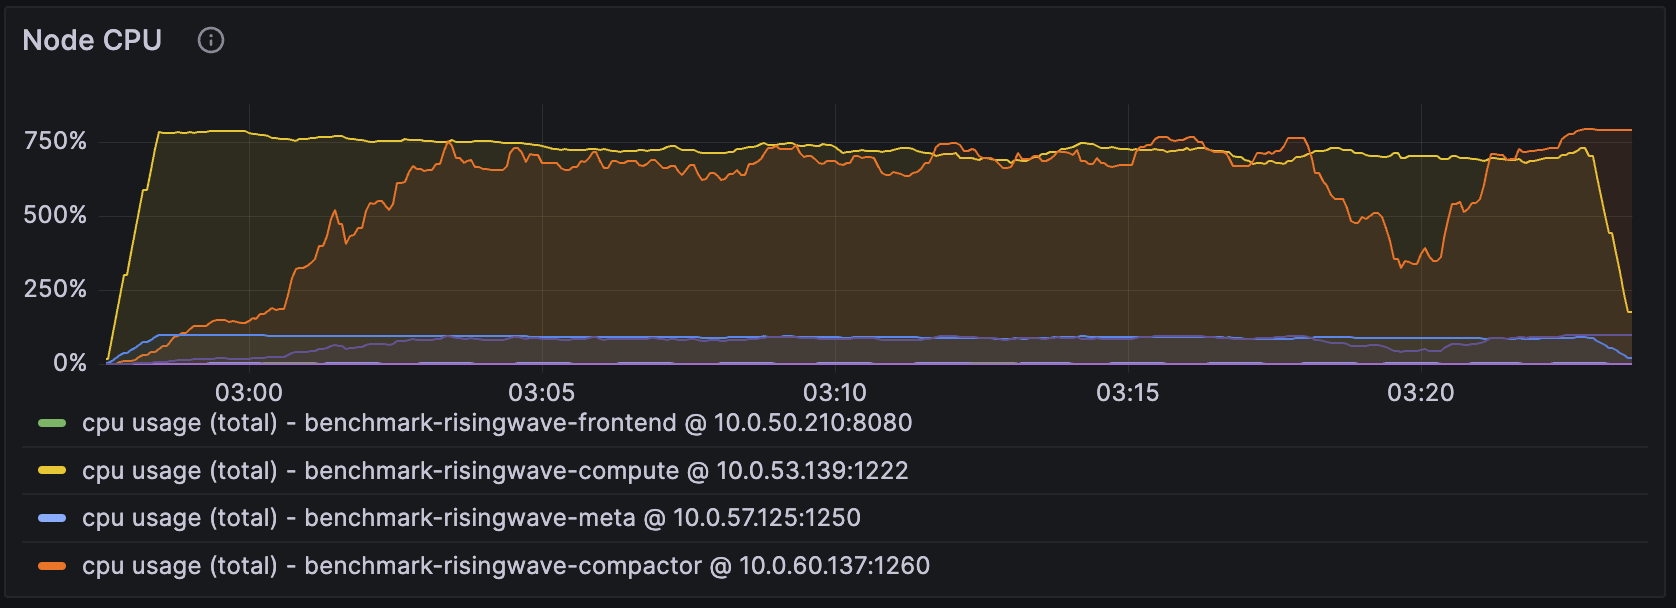
Among all of the components, we primarily focus on the CPU usage of compute nodes and compactor nodes. In the setting of the figure above, we have allocated 8 CPUs for the compute node and 8 CPUs for the compactor node.
Takeaway
When the CPU usage of the compute node is close to the total number of CPUs this compute node has (i.e., 800% in this case), we can likely improve the performance, e.g., throughput, by adding more CPUs to the compute node.
We can apply the same reasoning to compactor nodes. We will revisit this when we introduce the metrics “LSM Compact Pending Bytes”, which suggests the ideal number of CPUs to reserve for compaction workload.
Memory usage
A simplified description of RisingWave’s memory control mechanism:
RisingWave calculates and monitors the memory usage of each component.
RisingWave reserves 20% of the total memory, i.e., reserved memory, as a buffer. In case of a sudden spike in input data, RisingWave has enough time to adjust its memory usage.
RisingWave periodically checks the current memory usage against the rest 80% of the total memory, i.e., usable memory, and decides if it should evict data. If it exceeds 70% of usable memory, it gracefully evicts. The eviction will be further intensified if it exceeds 80% and 90%.
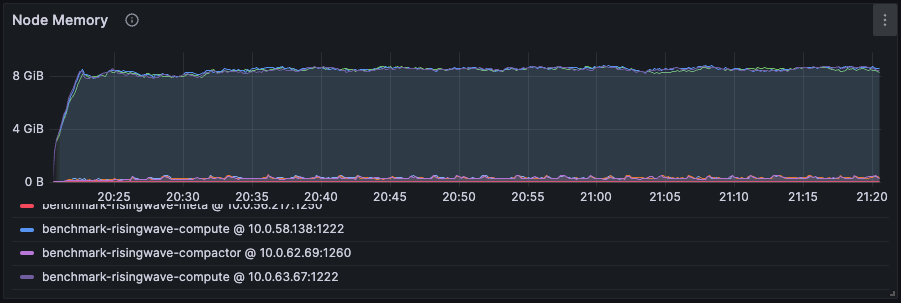
In the figure above, we have allocated 12 GB of memory to the compute node. The real memory usage keeps fluctuating around 8.64 GB (90% of usable memory). This suggests that the eviction is triggered constantly as RisingWave tries to use more memory.
Takeaway
If the memory is kept below 6.72 GB (70% of usable memory), we can be sure that the workload only asks for this amount. In other words, the data/state is completely kept in memory, as the eviction is never triggered. As a result, we can tune down the memory resources to save costs.
If the memory is higher than 70% of the usable memory, we consider allocating more memory to speed up if the extra cost is acceptable. Additionally, we recommend taking the cache miss ratio below into consideration when making this decision.
Cache miss
Operators such as Join and Aggregation are stateful. They maintain intermediate states in their operator cache to facilitate incremental computation.
For example, the following are the cache miss ratio metrics of the join operator, showing the metrics at the actor level. Each operator is parallelized by multiple actors, whose number is equal to the streaming_parallelism. By default, the parallelism is the same as the number of CPUs on compute nodes.
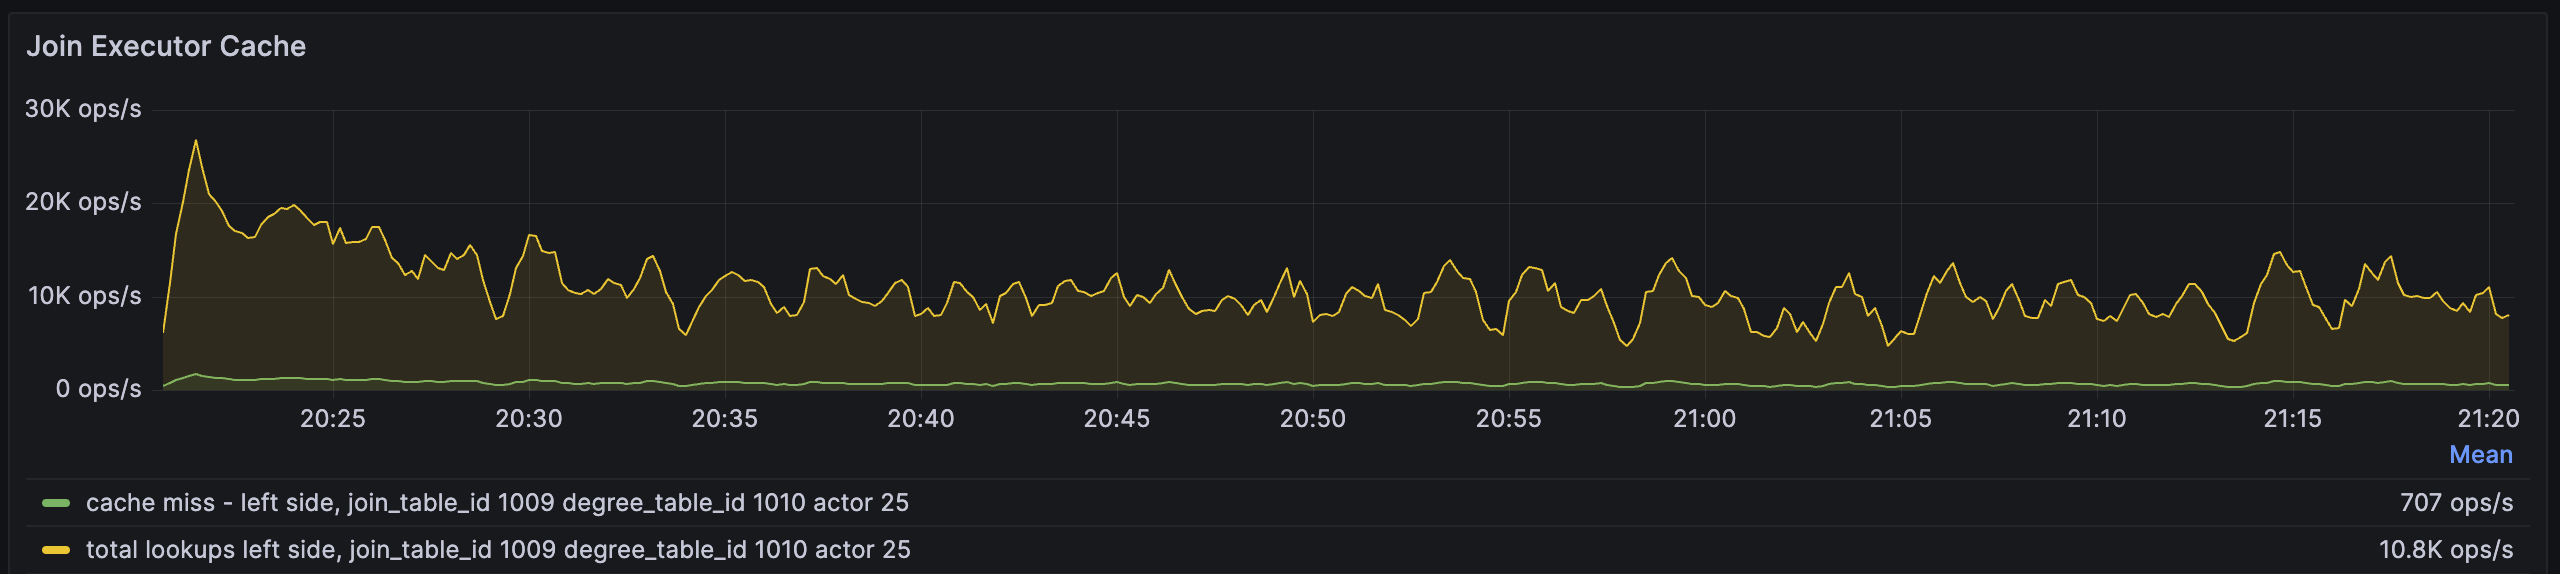
The total lookups metric denotes how many lookups a join operator performs per second, and the cache miss metric denotes how many times the key does not exist in the memory and RisingWave has to fetch it from the storage engine.
In the case above, the cache miss rate is 707/10.8K~=6%, which is quite low. Increasing memory may not do too much good.
Below is the same metric but for the aggregation operator.
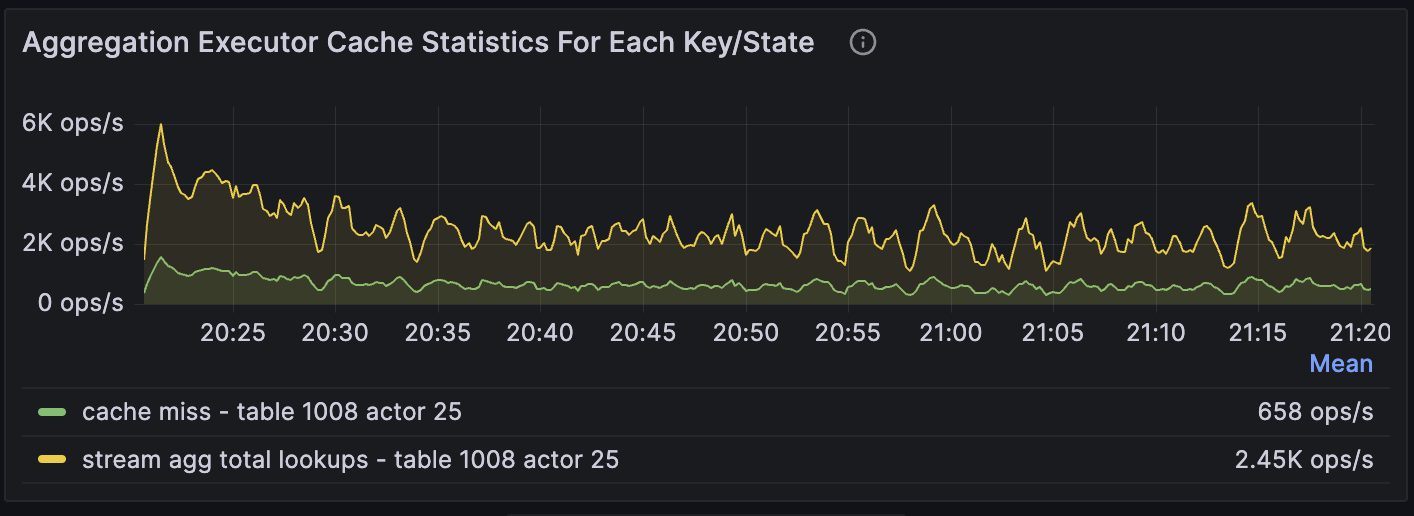
The cache miss rate of actor 25 is 658/2.45K ~= 27%, which is relatively high. It indicates that we are likely to improve the performance if we increase the memory.
Other than the operator cache, the storage engine named Hummock on each Compute Node maintains the block (data) cache and meta cache. The data cache stores data. Unlike the operator cache, the block (data) cache stores everything in its binary/serialized format. And all the operators share the same block cache. The meta cache stores metadata. Hummock requires metadata to locate the data files it needs to read from S3.
We also track the cache miss ratio of these two caches:
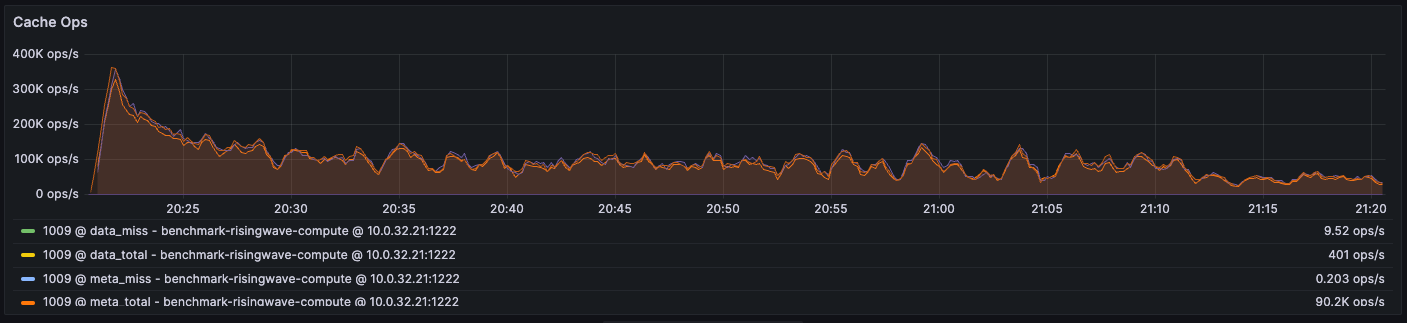
We calculate the cache miss rate of the block (data) cache to be 9.52/401 = 2% and the cache miss rate of the meta cache to be 0.203/90.2K ~= 0.0002%.
We notice that the number of total lookups to the meta cache is much higher than the number of total lookups to the data cache. This is because every lookup into the storage requires going through the meta cache, but it does not necessarily access the data cache or remote object storage every time. The meta cache has a bloom filter to check if the data actually exists, reducing the number of remote fetches happening.
It implies that even just a small percentage of cache misses in the meta cache can induce significant performance overhead due to the large total number of misses.
Takeaway
Monitor the cache miss metrics of the meta cache, the block (data) cache, and all the operator caches (ordered by importance) to estimate the potential room for improvement.
The number of cache misses is as important as the cache miss ratio because the latency of remote I/Os to object store such as 3 is incurred on each cache miss.
Whether we want to increase memory to improve performance is both user-dependent and workload-dependent:
- How much extra cost the user can afford
- The number of cache misses may be reduced a little (a lot) if the workload has a weak (strong) data locality.
LSM tree compact pending bytes
As described in the CPU usage section, we can estimate the ideal CPU resources allocated for compactors by considering the LSM Tree Compact Pending Bytes.
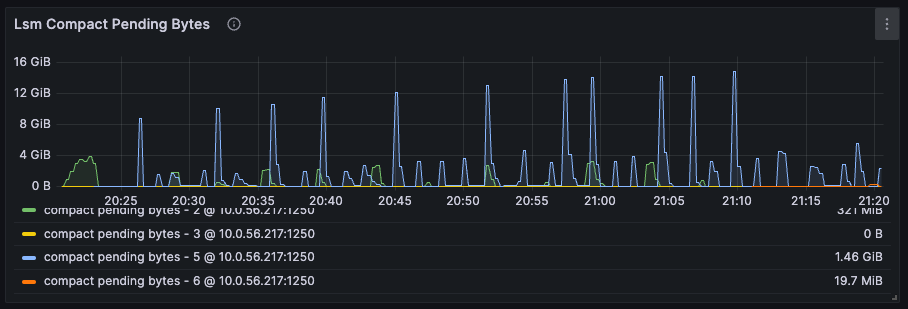
This metric illustrates the amount of pending workload from the compactor’s perspective. Due to the bursty nature of the compactor’s workload, we recognize the urgency to make a change only if the pending bytes have remained above a certain threshold for more than 10 minutes.
Takeaway
Since the total pending bytes keep changing, we first calculate its average over a time period of more than 10 minutes. As a general rule of thumb, we then divide the average over 4 GB to estimate the ideal number of CPUs.
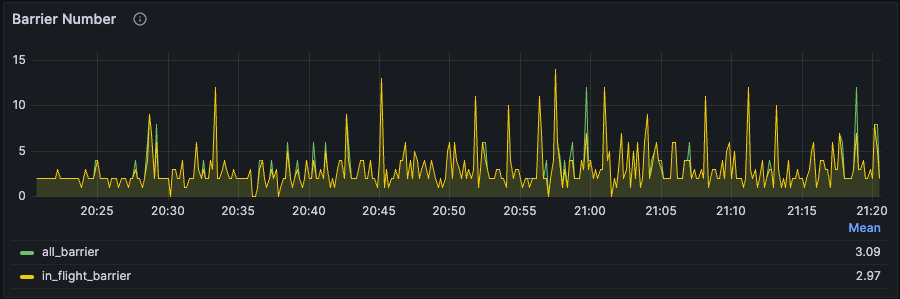
Barrier latency and barrier number
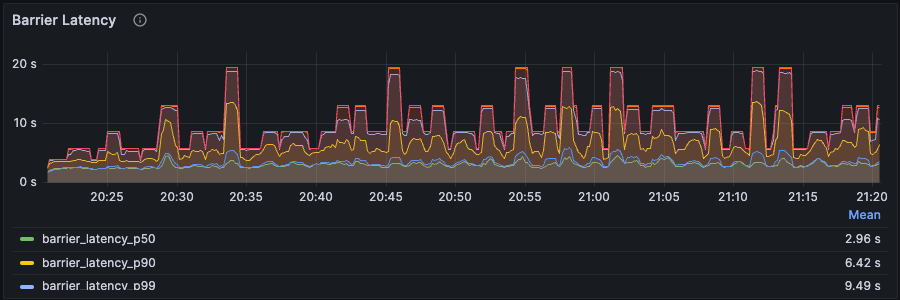
RisingWave by default generates a barrier every second and ingests it into the source operator (e.g., operators that read data from upstream) among regular input data. The barrier serves multiple purposes when it flows through each operator, e.g., triggering the computation of the delta between the current barrier and the last barrier, flushing new states into the storage engine, determining the completion of a checkpoint, etc.
In a perfect world, the barrier latency should stay at 1 second. But in reality, we may observe two phenomena in general:
The barrier latency keeps climbing and never enters a stabilized phase. At the same time, the number of barriers also keeps increasing. This implies that the system is in serious congestion, i.e., the current resource falls short of handling the workload. We likely need to increase CPU or memory resources by checking the other metrics mentioned above.
The barrier latency and the barrier number fluctuate but still stabilize around a certain level. This is not abnormal. Due to the dynamic nature of streaming data and RisingWave’s dynamic back-pressure mechanism, it is fine to experience such phenomena as RisingWave keeps adjusting at any given second.
Takeaway
We typically check them out first when we log into Grafana to diagnose any performance issues or even bugs. We further investigate which resources we need to increase once we run into the phenomena (1).
Source throughput
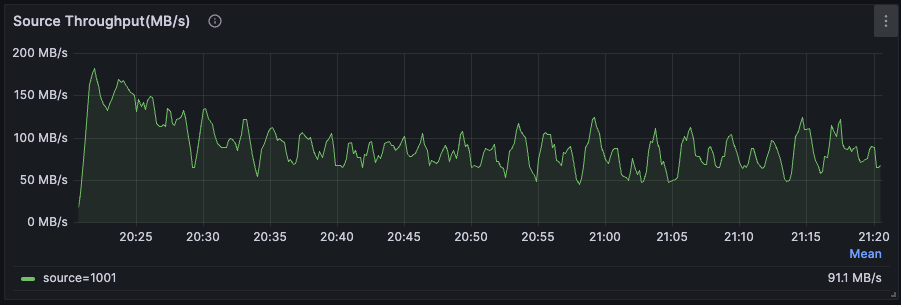
Particularly among stateless queries (e.g., simple ETL queries that transform data but do not involve stateful computation), we often find that RisingWave can be bottlenecked by the limitation of RisingWave’s upstream system.
For example, RisingWave may ingest data from an upstream message queue. Either the disk bandwidth of the message queue or the network bandwidth between RisingWave and the message queue is too low, the source throughput may not fully leverage RisingWave’s resources.
Takeaway
We suggest users also monitor the CPU utilization, disk I/O, and network I/O of RisingWave’s upstream systems, e.g., message queues or databases, to determine the end-to-end bottleneck.
For any other questions or tips regarding performance tuning, feel free to join our Slack community and become part of our growing network of users. Engage in discussions, seek assistance, and share your experiences with fellow users and our engineers who are eager to provide insights and solutions.


