Check status and metrics of clusters
You can check and monitor your clusters' overall running status and detailed metrics.
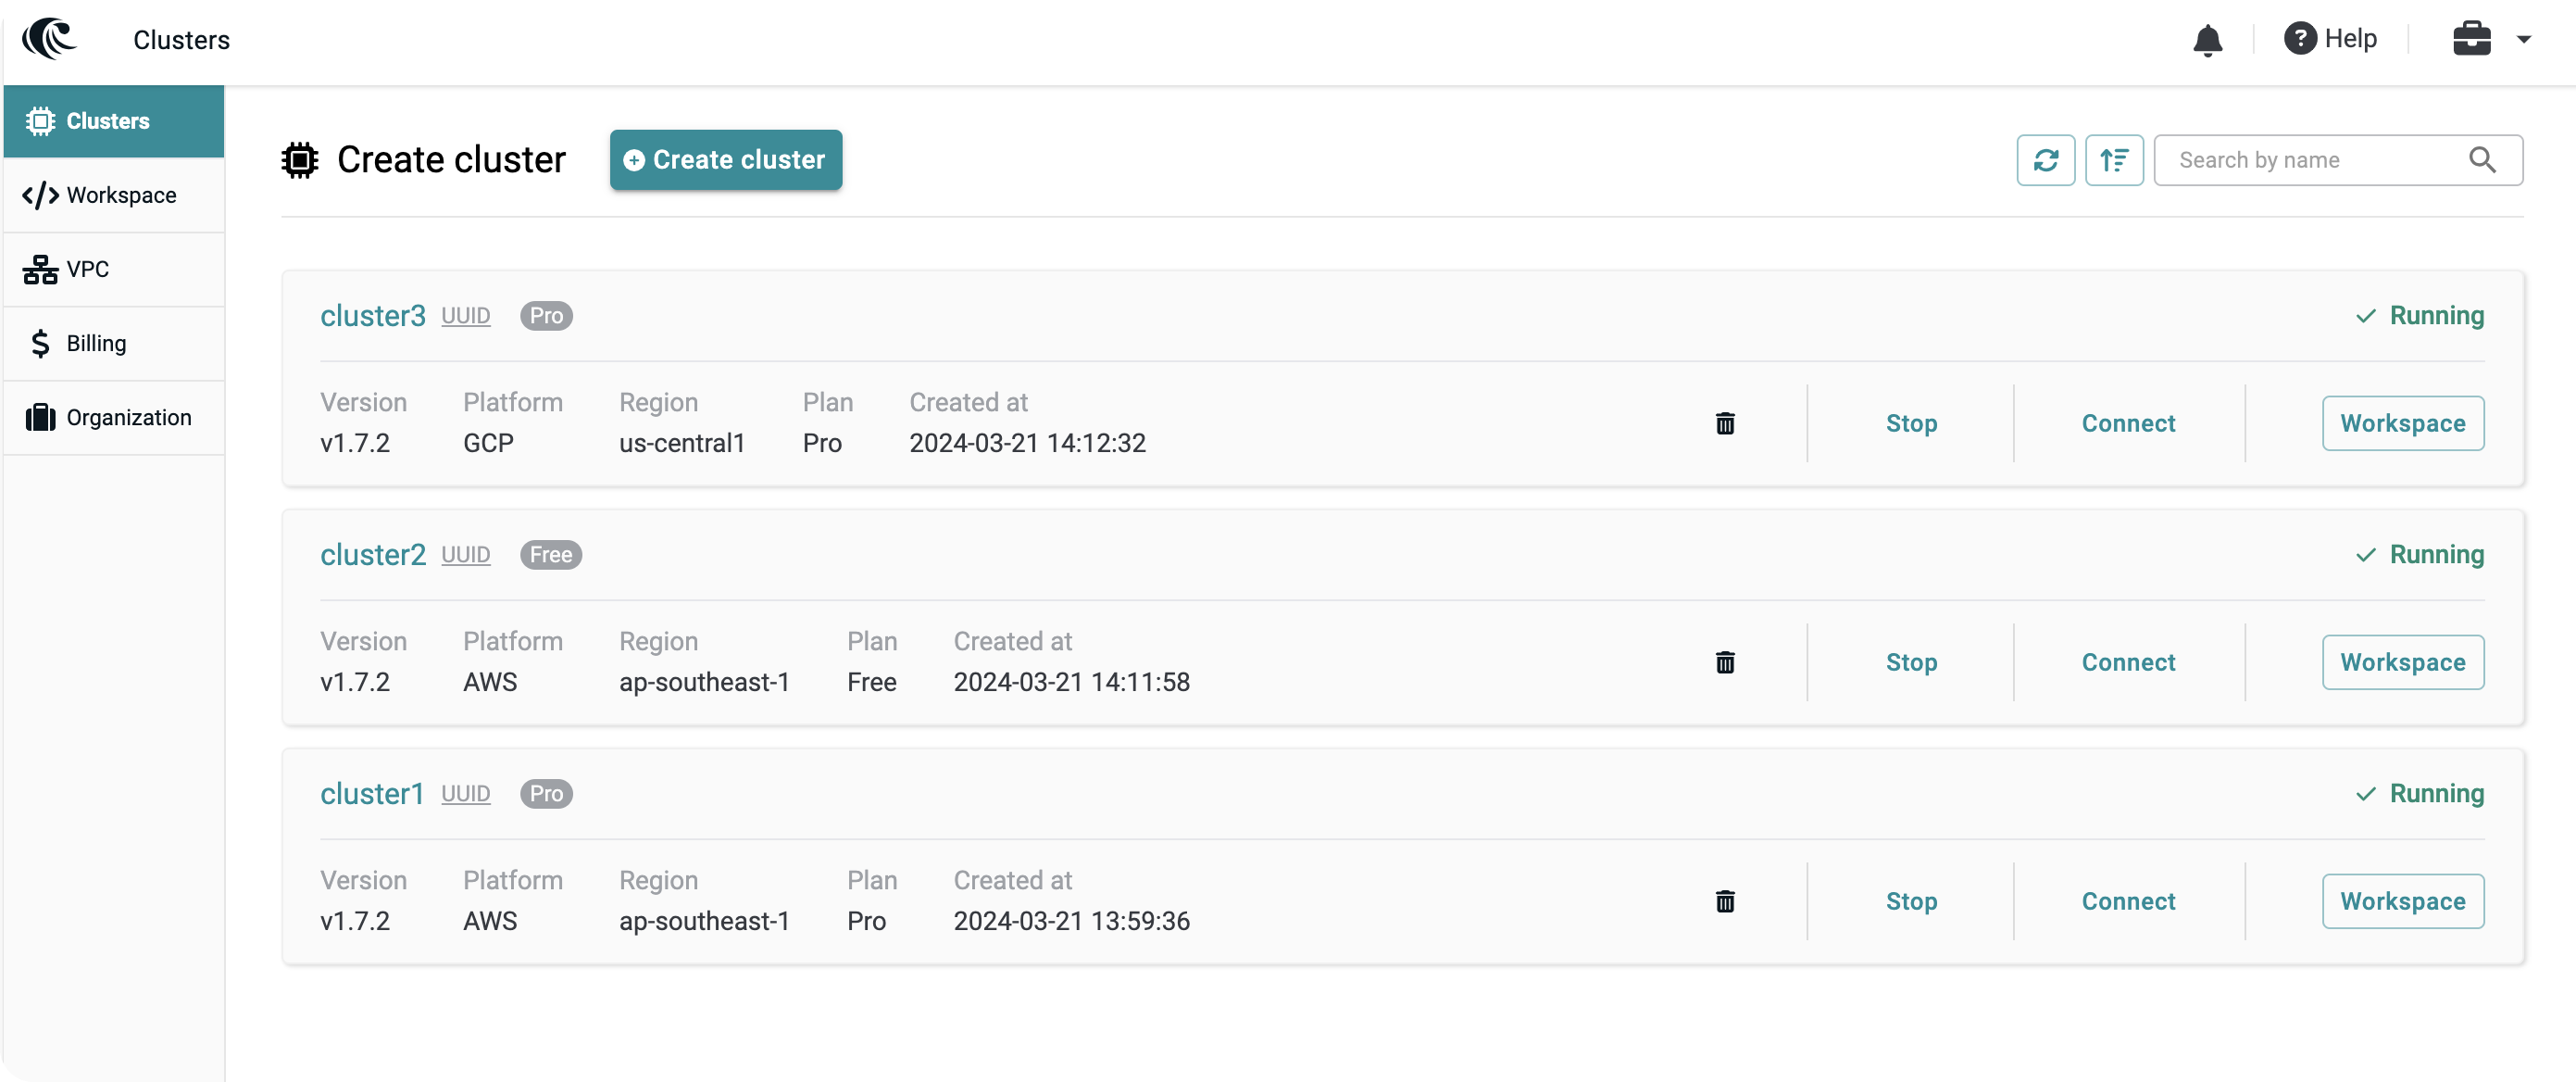
Check all clusters
To browse each cluster's configuration and running status in your account, go to Clusters.
In Clusters, you can see all the clusters in your account and control their running states. You can also check the current plan, RisingWave version, region, and creation time of each cluster here.
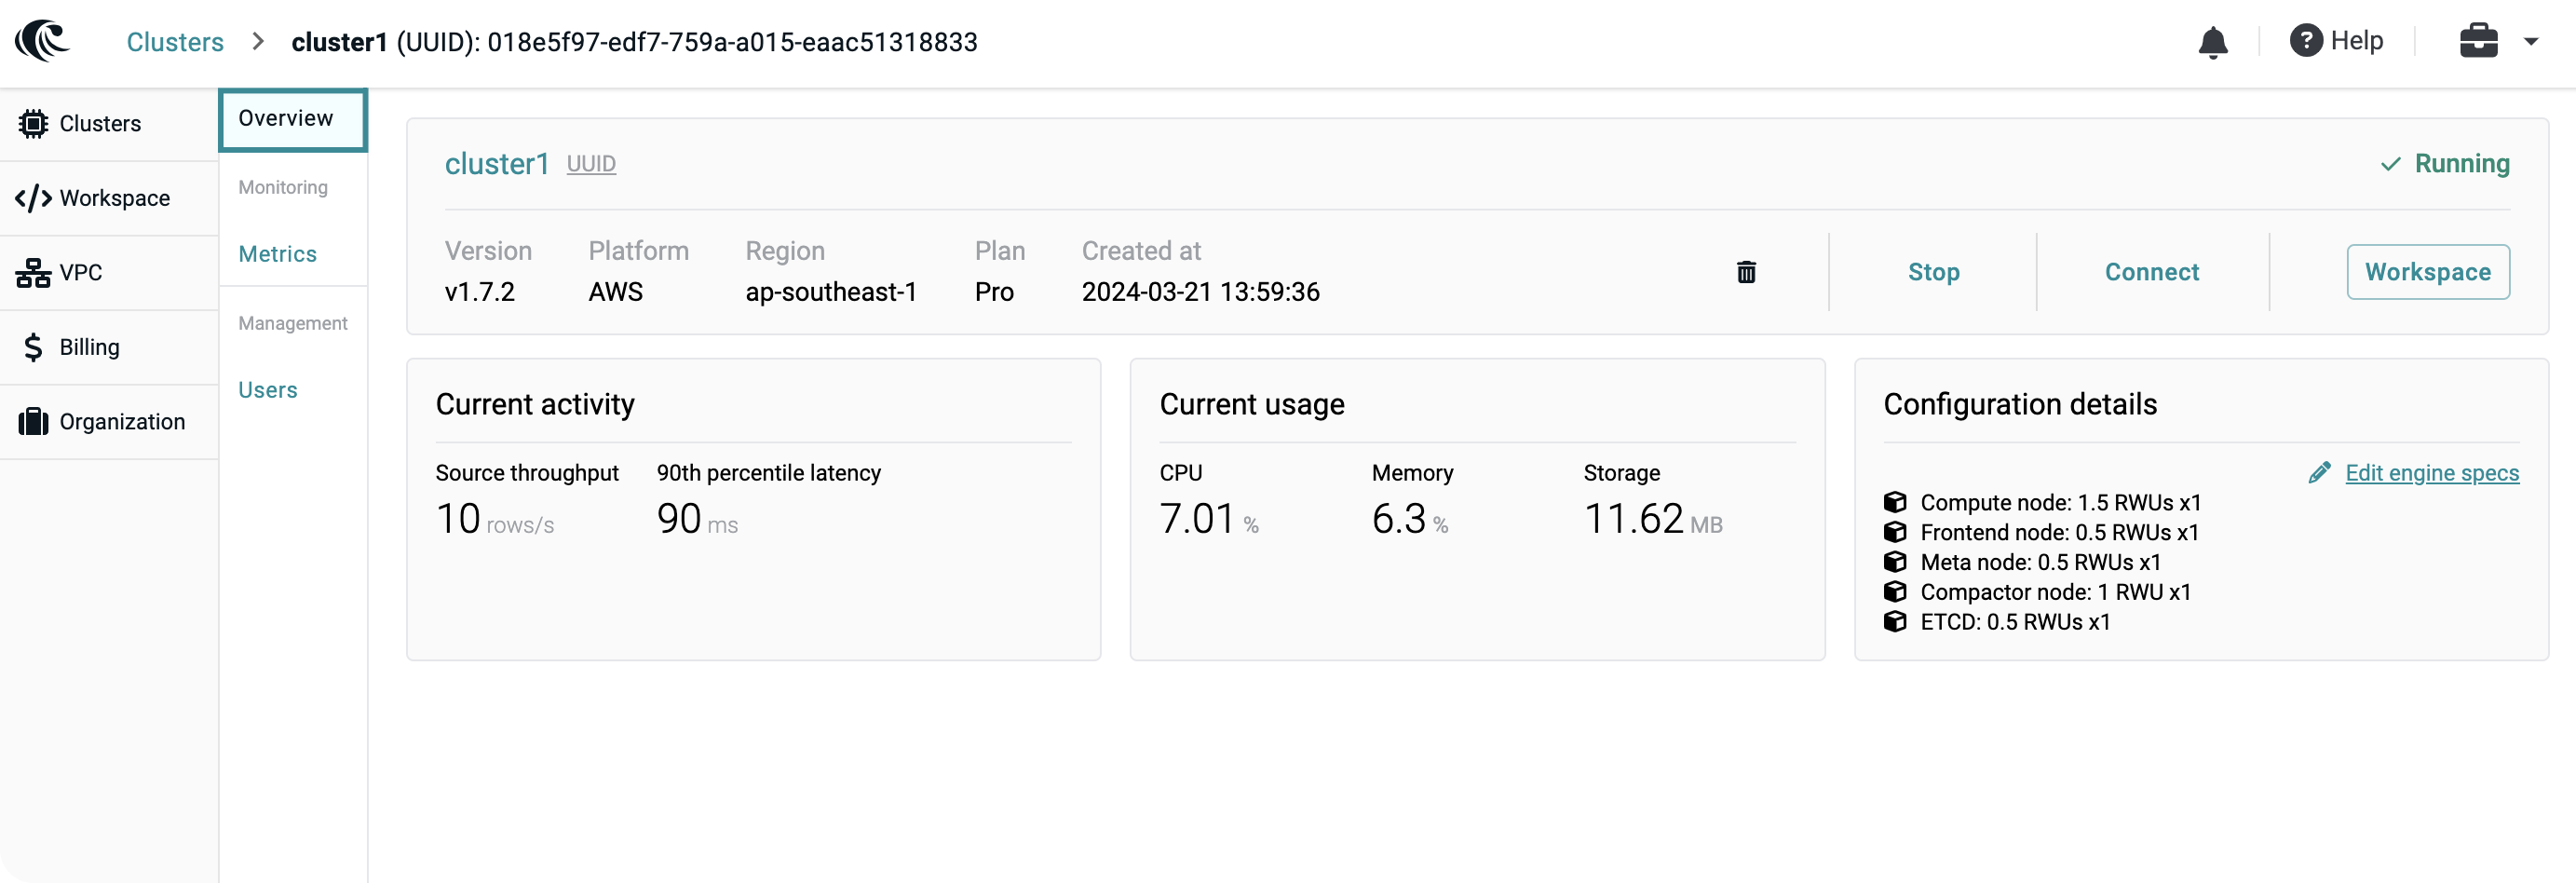
Check cluster details
To enter the cluster details page and check the information, such as current activities and resource usage, and monitor all metrics of a cluster, go to Clusters and click on the cluster.
The cluster details page includes:
- Current activities
- Configuration details
- Database users
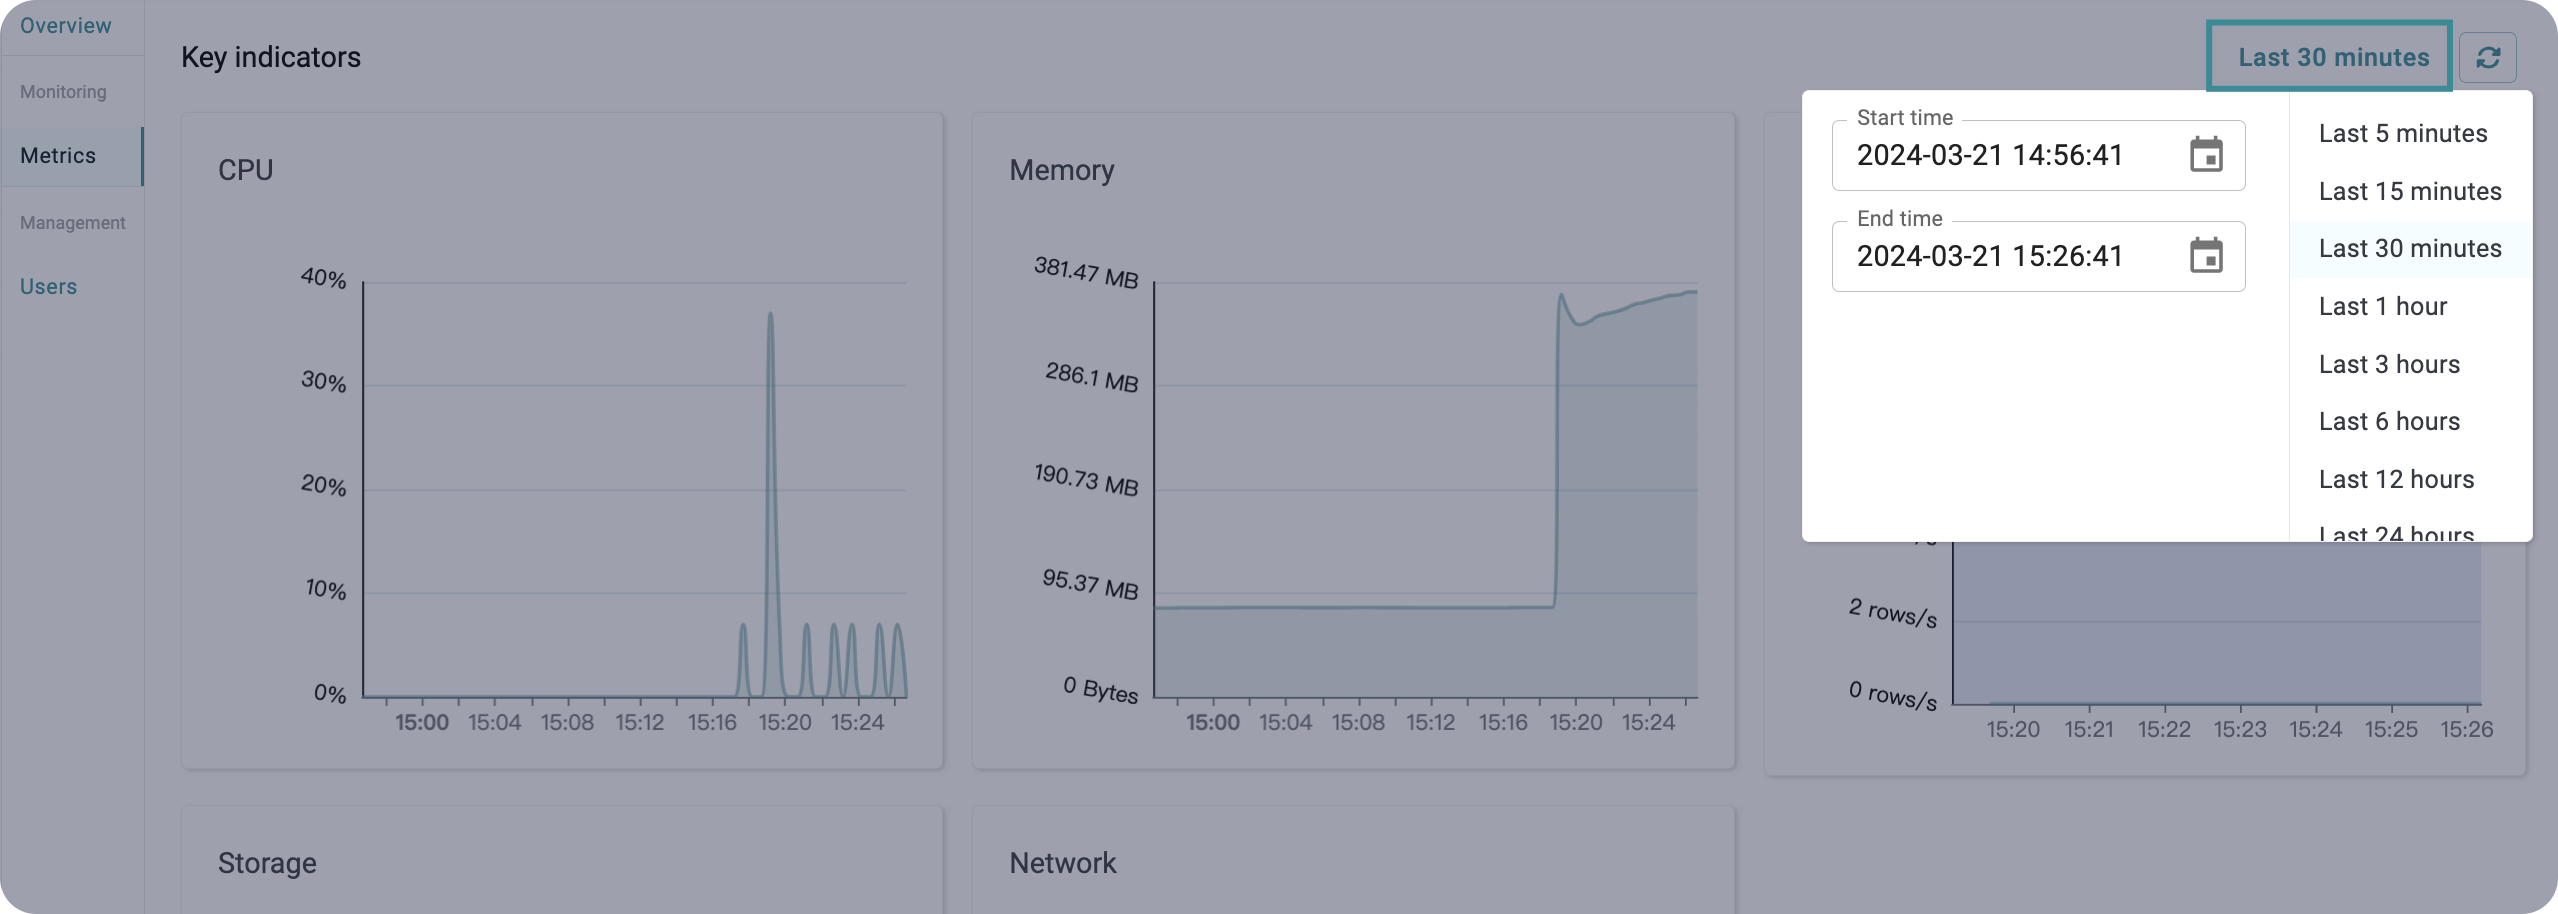
- Metrics
- Key indicators — CPU usage, memory usage, throughput, storage usage, and network
- Streaming — barrier latency, in-flight barrier number, backfilling throughput, backpressure rate
- Query — query per second, query average latency
- UDF — UDF call count, UDF latency, UDF throughput
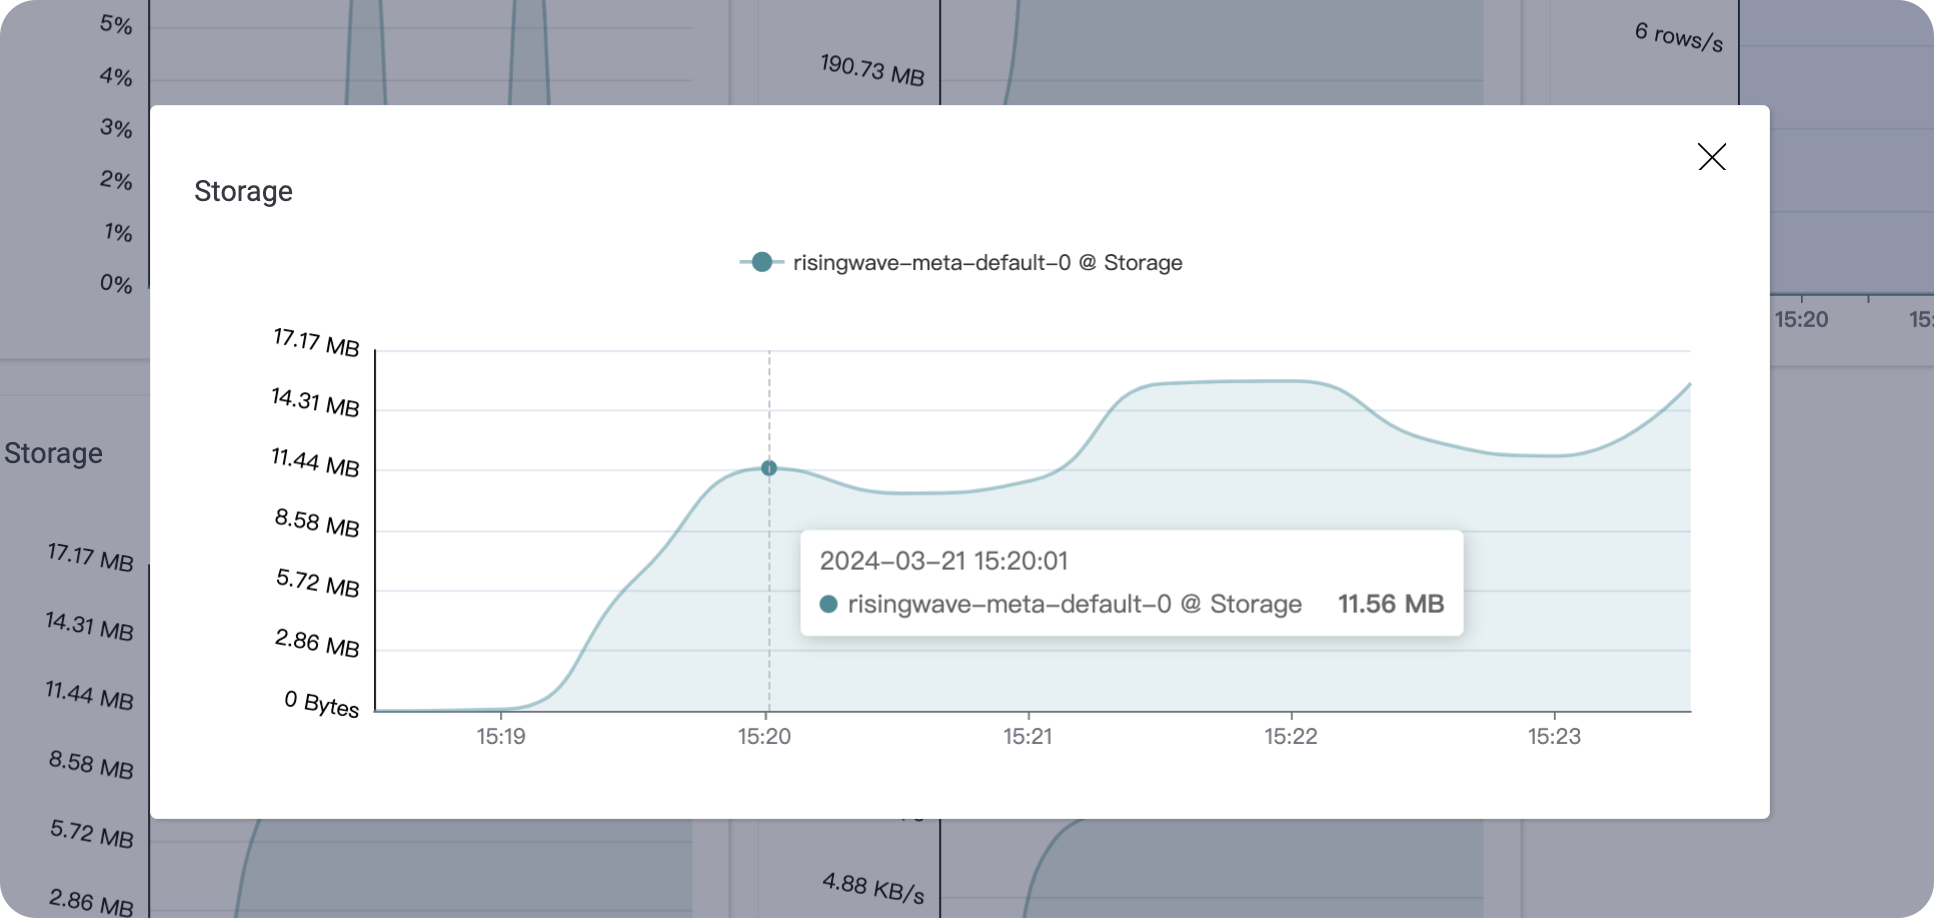
You can specify the time range of the metrics:
Or click on any item to view the details: