Troubleshoot out-of-memory issues
Out-of-Memory (OOM) is a common issue in data processing systems that can have multiple causes. This guide aims to help you identify the root causes of OOM errors and efficiently resolve the issues.
RisingWave uses shared storage like AWS S3 and uses the compute node's memory as a cache to enhance streaming jobs. The cache operates in a Least Recently Used (LRU) manner. That means the least-used entries will be removed when memory becomes insufficient.
For optimal performance, the recommended minimum memory for a compute node is 8 GB, but we suggest using 16 GB or more for production usage.
This guide focuses on addressing OOM issues on the compute node. If you encounter OOM on other nodes, we recommend upgrading to the latest version first. If the issue persists, please contact us.
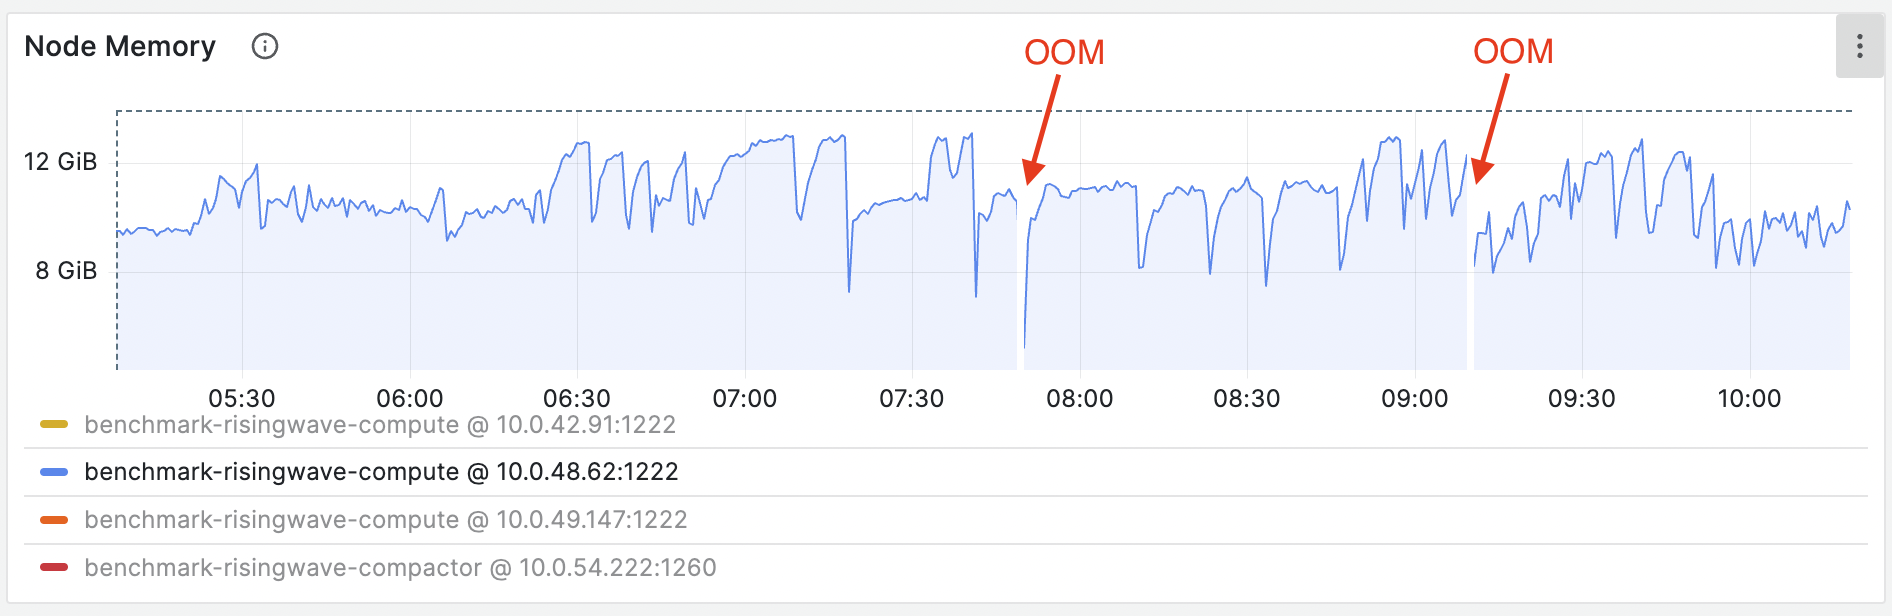
OOM symptoms
- The Kubernetes shows the compute node pod suddenly restarts due to OOM Killed (137).
- The Grafana metrics show memory increases unbounded, beyond the limit of
total_memoryset for the compute node. Memory settings can be found in the booting logs of the compute node. Search for keyword “Memory outline" to locate the specific section.
OOM when creating materialized views
If OOM happens during creating a new materialized view, it might be caused by the large amount of existing data in upstream systems like Kafka. In this case, before creating or recreating a materialized view, you can reduce the traffic by specifying the rate limit:
SET RW_STREAMING_RATE_LIMIT = <rate_limit_per_actor>
Note that the limit value must be larger than the value for stream_chunk_size (usually 256). Otherwise the flow control executor can’t throttle the chunk.
If the query of the materialized view is complex, consider improving the query performance.
OOM caused by barrier latency
Barrier plays a vital role in our system, supporting the proper functioning of important components like memory management and LRU caches.
Instead of solely addressing the memory problem, we recommend investigating why the barrier is getting stuck. This issue could be due to temporary network issues or internal performance concerns. To troubleshoot effectively, please dump the Async Stack Trace of all compute nodes on the RisingWave Dashboard and reach out to us in our Slack channel #troubleshooting. We'll provide further assistance and guidance to help resolve this issue promptly.
OOM due to other reasons
We have added a built-in memory profiling utility in version 1.3 of RisingWave. This utility automatically dumps heap profiling results when the memory usage reaches the threshold of 90%. Additionally, users can trigger a manual dump of the memory profile.
The memory profiling results in collapsed format and can be visualized using flamegraph tools such as FlameGraph or online tools such as Speedscope and flamegraph.com.
If you have any questions or need assistance with analyzing the memory profiling results, please don't hesitate to reach out to us in our Slack channel #troubleshooting. Please remember to attach the analyzing result for further assistance.


